![]() Insights brings you the power of embedded business intelligence and all the analytical and graphical power that comes with it – (more…)
Insights brings you the power of embedded business intelligence and all the analytical and graphical power that comes with it – (more…)
 As a continuation from our Top Five Tips for Working from Home blog, here is our second part of the series – our top tips for managing a remote team for our clients who use Maximizer CRM.
With more and more businesses having their staff work from home and joining what Time has called ‘the world’s largest work-from-home experiment‘, being able to effectively manage your team is a must. With Maximizer CRM, you have the tools to do just that. (more…)

Excel is a powerful reporting tool, providing options for both basic and advanced users. One of the easiest ways to create a report in Excel is by using the Pivot Table feature, which allows you to sort, group, and summarise your data simply by dragging and dropping fields.
What if I told you that you can export your data from Maximizer straight into Excel with pivot tables and reporting tools already created? This can save you a lot of time in building reports for directors or anyone else that might require the reports.
The Maximizer to Excel integration allows you to dig deeper into the information that you hold from all of the data across your business. You can quickly export to Excel whenever the need arises with a single click in Maximizer CRM.
By exporting your Maximizer entries to an Excel spreadsheet and using the sorting, filtering, graphing, and formatting functionality of Excel provides detailed reports on your Maximizer data allowing to guide your business on decisions informed by the data that you collect on a daily basis.
You can access Excel reports via the Report menu in the Address Book, Opportunities, Customer Service, Campaigns, and Hotlist pages.
Each Excel report template is associated with a column setup. The selected column setup determines the fields that are included in the downloaded report data and should match the fields used in the report.
At a click, export data from Maximizer to Excel for deeper analysis and sharing. Using the data from Maximizer and the functionality provided by Excel opens the doors to in-depth analysis and greater insights into how your business runs and where the money is coming from.
Empower your team with fast Excel quoting. Using Maximizer and Excel functionality allows you to build standardised quote templates and populate them with company, customer and product details. Then sync the quoted values with your opportunities module for much more in-depth forecasts.
Dig deeper into your sales, marketing and customer service data with interactive Excel reports. Choose from Maximizer’s built-in library of report templates or upload your own, and populate it with your favourite data points at a click.
If you are looking for something more complicated, the team at Collier Pickard can build bespoke reports that pull data from anywhere within Maximizer. These will show you exactly what you need to see, allowing you to view anything, the average time from enquiry to order, to the average size of deal per salesperson. As long as the data is there, we can build reports on anything.
We recently had a report requested from a loan provider showing how their opportunity revenue has progressed week by week over the last year, with the report split by outcome (paid out, in progress, declined, etc.).
We then provided a bespoke report taking data directly from Maximizer to produce a stacked bar chart providing the senior staff with a snapshot of their opportunity performance.
The same client also asked us to create a report allowing them to analyse the performance of their sales team. For this, we created a simple pivot table showing multiple variables such as average loan revenue and number of sales.
This report also collated revenue over the previous year and contains filters allowing the user to view any period of weeks or months within the time frame to be filtered.
Using excel in conjunction with your Maximizer CRM can give you some powerful insights in an easy to digest form. Allowing you to quickly see in-depth analysis on any aspect of your business can help guide business decisions in the long-term and make your business more profitable.
This is simply a brief look at what you can achieve by using Maximizer and Excel together. If you would like to talk about how you can use Excel reporting within Maximizer, then please get in touch.
With Collier Pickard, you have access to over 25 years of experience in the industry and the expertise that comes along with that. We have been helping a variety of businesses throughout a variety of sectors for many years and we’d be pleased to help you.

If you don’t know what you’re looking for, setting up dashboards in Maximizer can be quite intimidating. If you’re not sure how to make them work, look no further. This blog will walk you through the basics of CRM dashboards – what they are, who they were made for, and most importantly, how to make them.

Photo credit: Eva Gross
There may be instances when you want to find out who, in your Maximizer CRM system, is located near a certain location. For example, if you’re in marketing, you may want to know who is in a particular area when planning seminar invites or regionally focussed campaigns. Or if you’re a salesperson, you might want to maximise your use of time when out of the office visiting clients, prospects or suppliers… “Who else can I visit whilst I’m in this area?” So how would you conduct this search? (more…)

Photo credit: Eva Gross
What do you do when someone leaves a company? Do you delete them from your Maximizer CRM system or do you make a note against their record? Do you have a User-defined Field (UDF) for people who have left or do you have some other way of categorising them? In short, how do you keep tabs of the comings and goings of company employees without losing or compromising important information surrounding your relationship with them? (more…)
 Dashboards in Maximizer CRM are great tools to use as they provide you with a detailed view of activities of your choice, making it easy to monitor progress. What’s more, dashboards allow you to see metrics in real time so you can quickly assess which areas require attention. In this blog, we will explain how to use formula fields in Maximizer CRM to format date fields for use on dashboards. This assumes that you already know how to create Maximizer dashboards, catalogue searches and user-defined fields (UDFs). If not, contact us for more information.
There are a few occasions when an actual date doesn’t work well on a dashboard. Some examples:
To create these types of dashboards, we may need to create formula fields that format the date value into something more useful for a dashboard indicator to use.
When creating these formula fields it is important to remember how Maximizer will sort data in a dashboard. Numeric formula fields will sort numerically, and alphanumeric formula fields will sort alphabetically.
So a numeric field with values 1 to 12 would sort 1, 2, 3, 4, 5, 6, 7, 8, 9, 10, 11, 12 whereas an alphanumeric field would sort 1, 10, 11, 12, 2, 3, 4, 5, 6, 7, 8, 9. To get the alphanumeric field to sort correctly we would need to add a leading 0 for 1 to 9, so you get 01, 02, 03, 04, 05, 06, 07, 08, 09, 10, 11, 12.
For these examples, I have created an opportunity date user-defined field called ADateUDF as the source date. However, any date field or date user-defined field could be used as the source date.
In these examples, all of the dashboard indicator screenshots use the same opportunity search and display the data as bar charts which count records that are grouped and sorted by the formula field. The bar chart settings are set to turn off both 3D and grid lines.
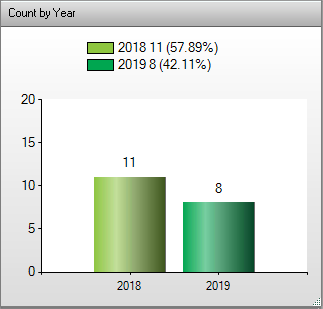
Dashboard Indicator: Count opportunities by year.
Numeric Formula: year([ADateUDF])
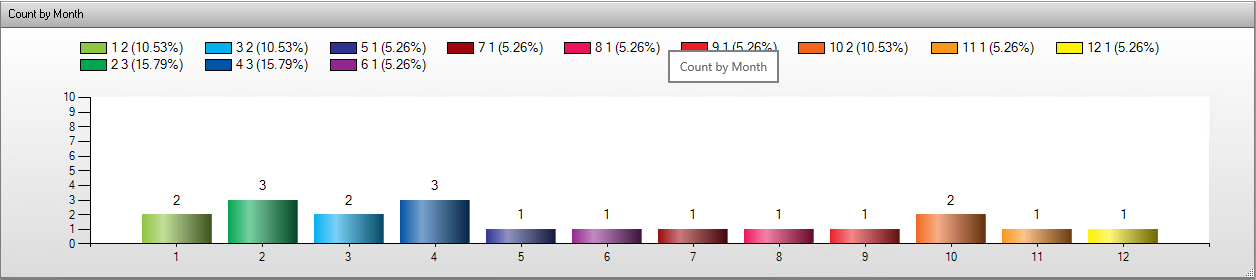
Dashboard Indicator: Count opportunities by month
Numeric Formula: month([ADateUDF])
Note: this dataset has multiple years of data and the grouping is just by month. This may not always be desirable as multiple years for the same month will be combined.
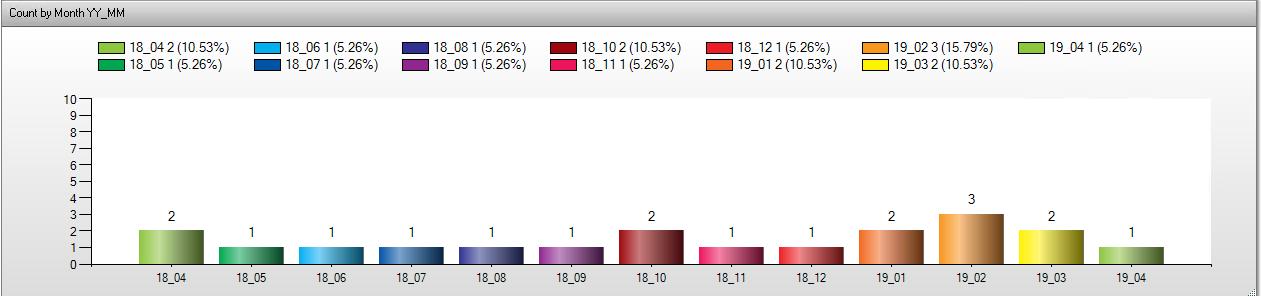
Dashboard Indicator: Count opportunities by year and month
Alphanumeric Formula: mid(text(year([ADateUDF])),3,2) + “_” + if(month([ADateUDF]) < 10, “0” + text(month([ADateUDF])), text(month([ADateUDF])))
Note: this formats the year and month as a two digit year and a two digit month in the format YY_MM. If the month number is less than 10 the month is prefixed with 0.
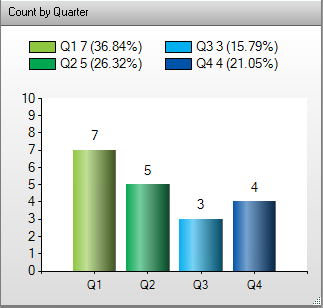
Dashboard Indicator: Count opportunities by Calendar Quarter
Alphanumeric Formula: “Q” + text(floor((month( [ADateUDF] ) – 1) / 3) + 1)
Note: this prefixes the quarter with Q. Again, this dataset has multiple years of data and grouping is just by quarter. This may not always be desirable as multiple years for the same quarter will be combined.
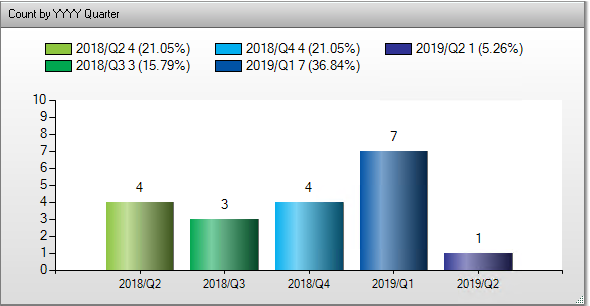
Dashboard Indicator: Count opportunities by Calendar Quarter
Alphanumeric Formula: text(year( [ADateUDF] )) + “/Q” + text(floor((month( [ADateUDF] ) – 1) / 3) + 1)
Note: this prefixes the quarter with the four digit year. This could be shortened to be a two digit year like the previous example for year and month.
Further reading on the syntax for formula fields can be found in the “Writing Formulas and Mandatory Rules” in the Maximizer Administrator manual. Alternatively, contact us to find out how you can make the most out of Maximizer CRM dashboards… we’d be happy to help you learn more about formula fields in Maximizer CRM!